Earthquakes pose a significant hazard, and due to the growth of vulnerable, exposed populations, global levels of seismic risk are increasing. In the past three decades, a dramatic improvement in the volume, quality and consistency of satellite observations of solid earth processes has occurred.
In a recent paper (https://link.springer.com/article/10.1007/s10712-020-09608-2) I review the current Earth Observing (EO) systems commonly used for measuring earthquake and crustal deformation that can help constrain the potential sources of seismic hazard. I examine the various current contributions and future potential for EO data to feed into aspects of the earthquake disaster management cycle. I discuss the implications that systematic assimilation of Earth Observation data has for the future
assessment of seismic hazard and secondary hazards, and the contributions it will make to earthquake disaster risk reduction.
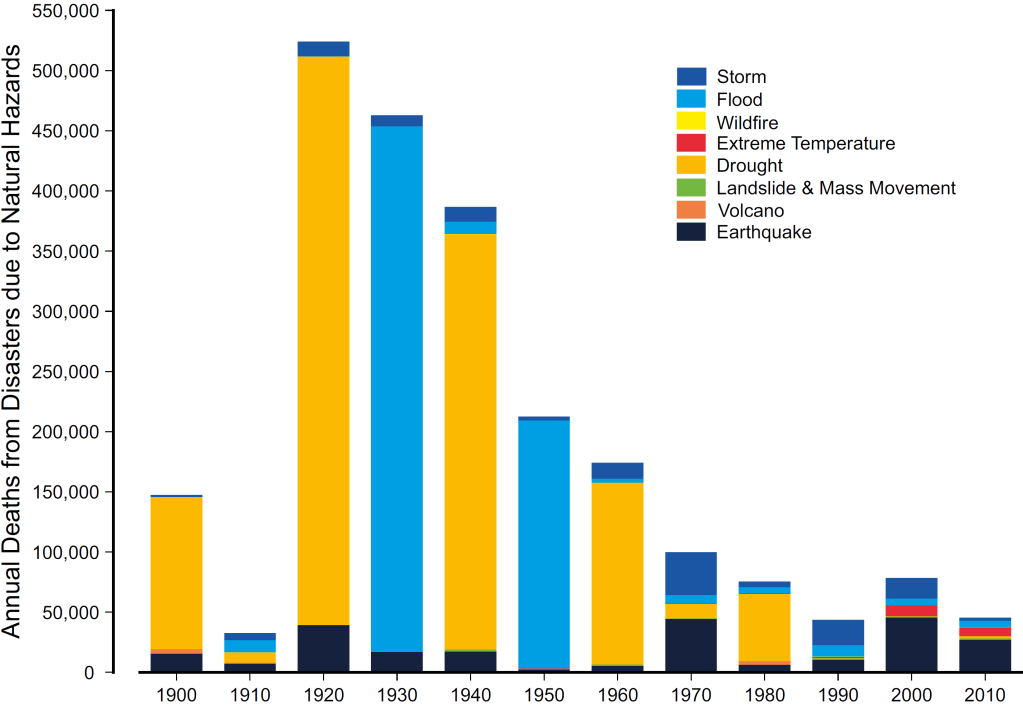
Whilst globally the death rate from natural disasters such as flooding and drought has declined dramatically in the past century, the fatality rates from earthquakes (Fig. 1) have remained persistent. It is a target of the Sendai Framework for Disaster Risk Reduction to reduce the global disaster mortality rate (along with those affected and economic losses) for this coming decade compared to the past decade. However, as populations continue to grow and cluster, an increasing number of people are exposed to the hazards from earthquakes, having gathered to live in urban centres and thus created megacities over recent decades (Fig. 2).
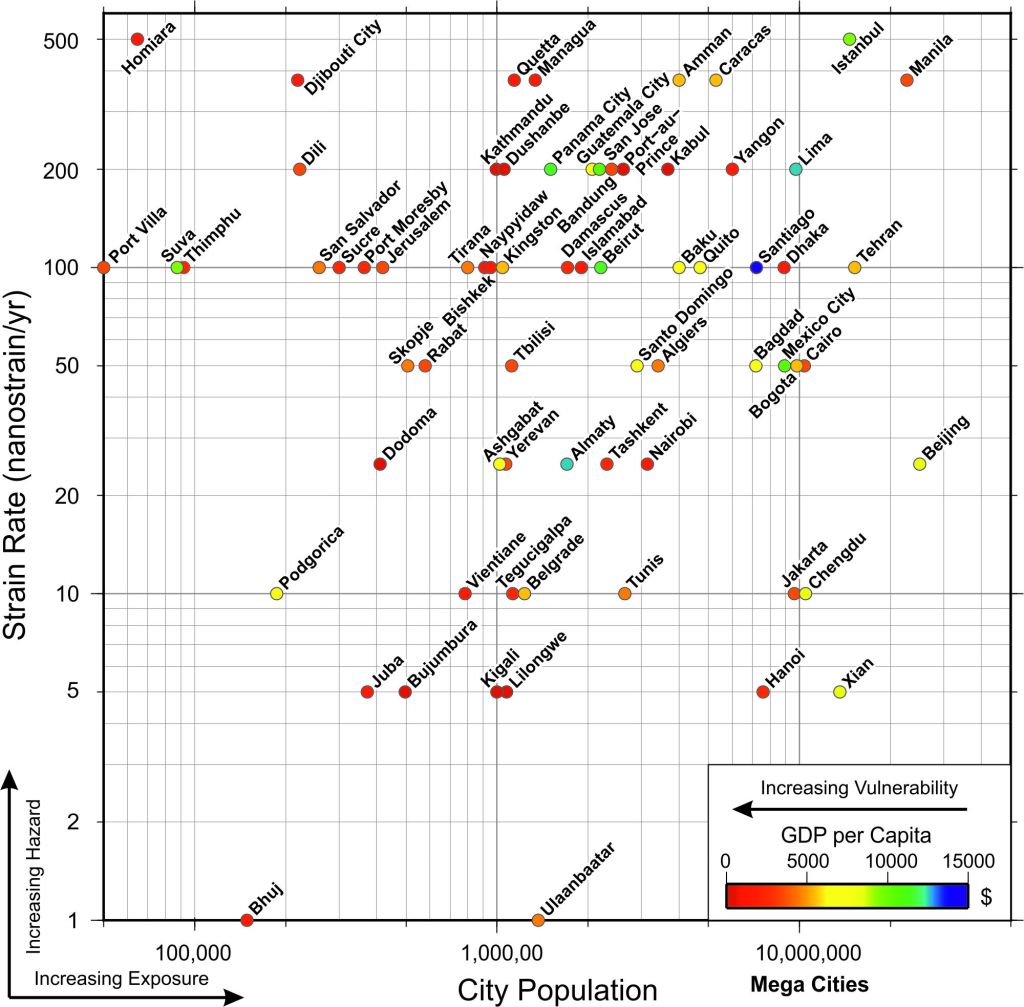
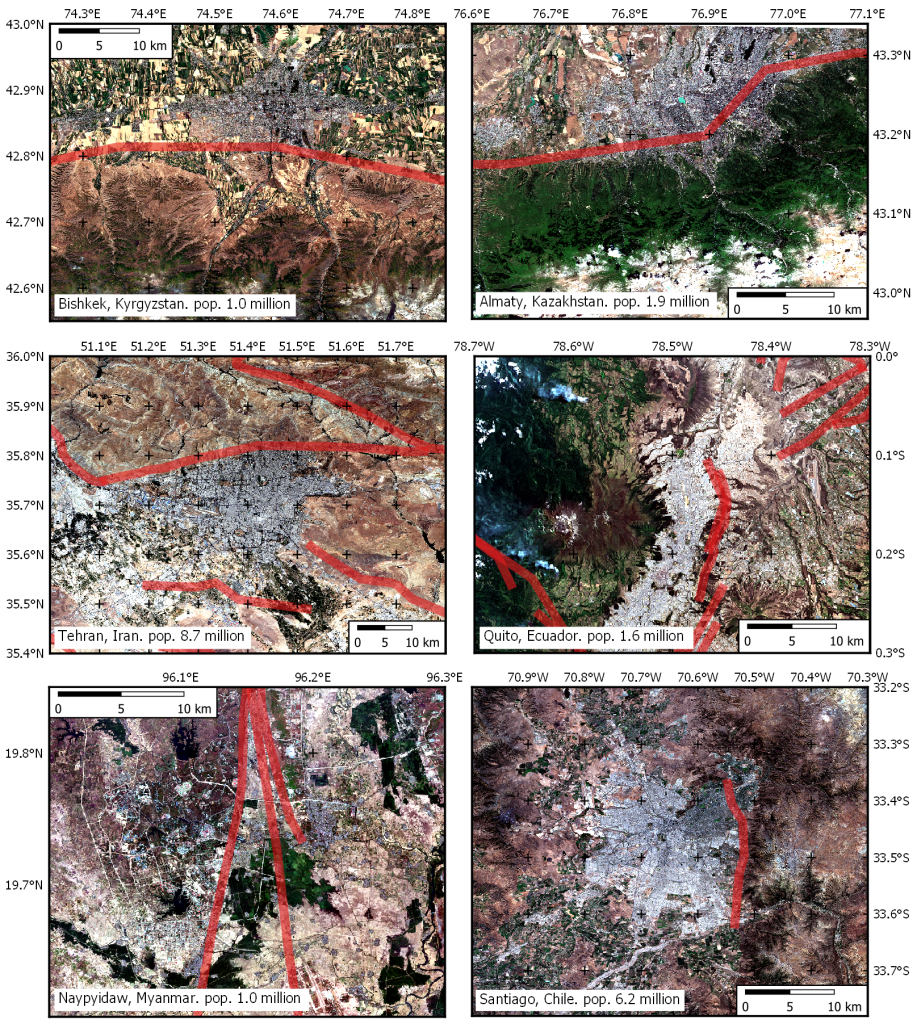
These population centres are often clustered along fault lines (Fig. 3) resulting from historical trade routes, water supplies, fertile basins and security that exist due to the mountains created by the same tectonic processes that cause the underlying hazard. Rapid population growth in economically developing countries, many with limited economic resources or facing other pressing near-term priorities, has led to housing structures of often limited seismic resilience, thus contributing to a heightened vulnerability of those exposed. Furthermore, entrenched and deep-seated corruption tends to by-pass any attempts made to improve this situation with seismic design codes in some countries where earthquake hazard is recognised but ignored. This duplicity results in much worse outcomes in the face of an earthquake disaster than expected, given the prevailing income level.
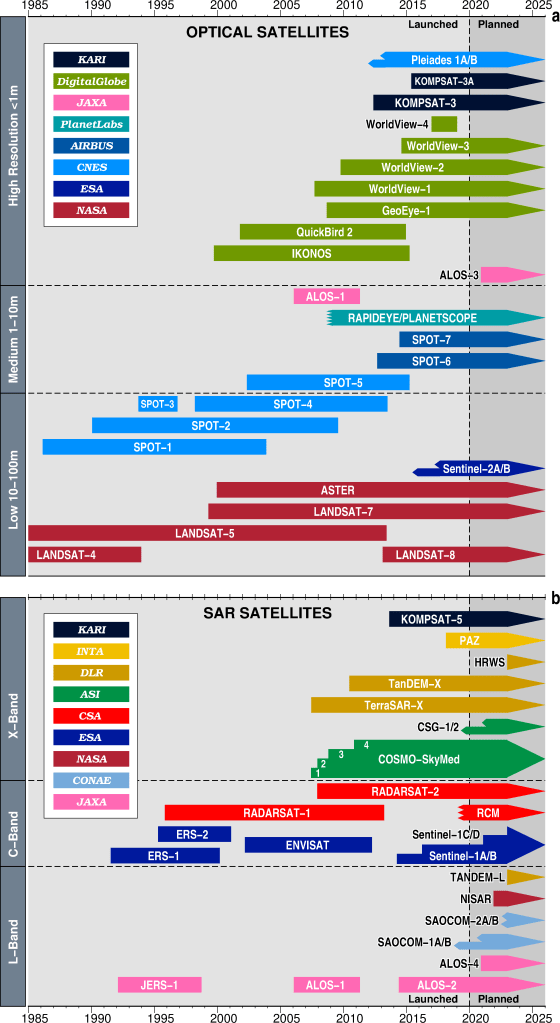
Over the past few decades an ever-expanding fleet of Earth Observation systems have been launched in into low-earth near polar orbit, enhancing our capability to monitor solid earth hazards. This continued expansion of satellite capacity (Fig. 4) has occurred both for active radar (synthetic aperture radar—SAR) and passive optical imaging systems (multi-spectral—MS).
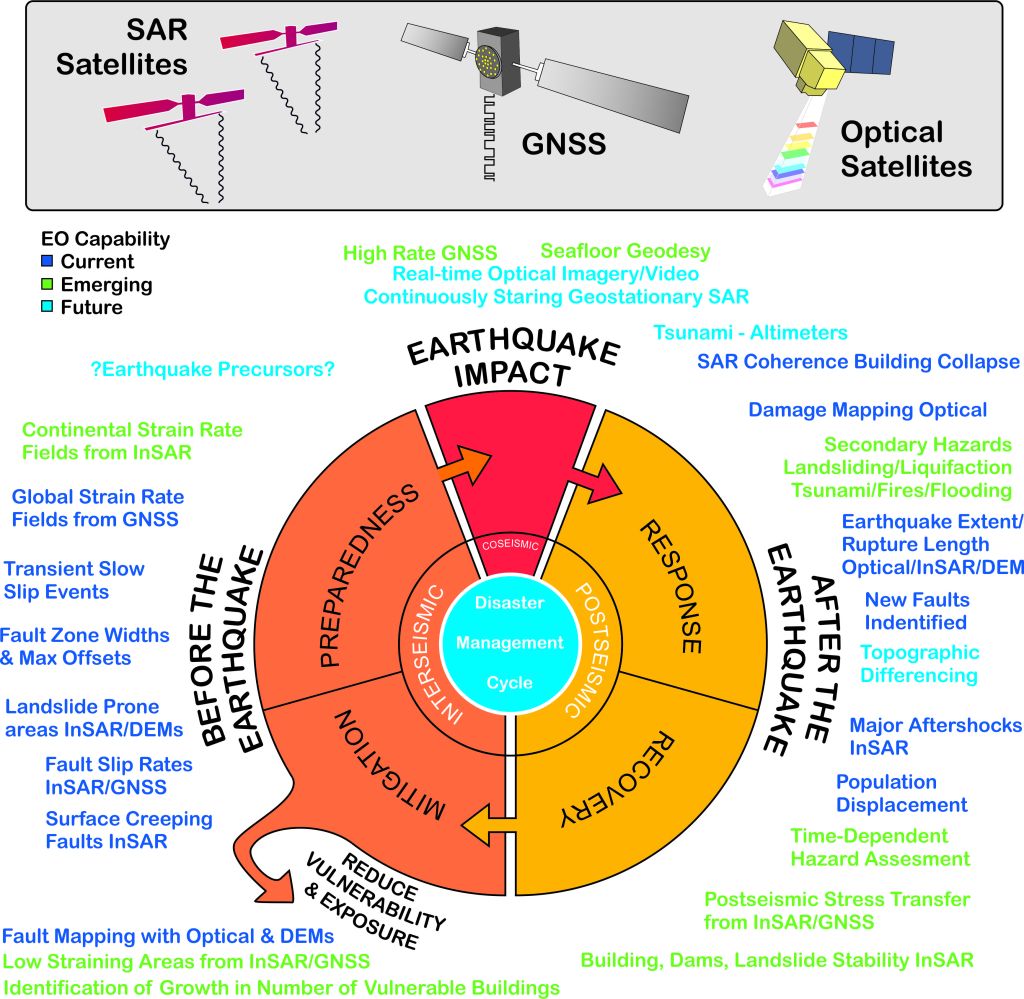
Earth Observation and the Disaster Risk Management Cycle
A priority for action identified within the Sendai Framework for Disaster Risk Reduction is to understand disaster risk. Earth Observation can play an important role in achieving this in terms of characterising the sources of seismic hazard as well as the exposure of persons and assets, and the physical environment of the potential disaster. Therefore, EO can contribute to both understanding the hazard element of disaster and some of the contributors to the risk calculation, namely where populations and buildings are located relative to the sources of such hazards. Furthermore, EO can drive the enhancement of disaster preparedness for earthquakes so that a more effective response and recovery can occur by highlighting the regions exposed to earthquake hazards, thus addressing a further priority of the Sendai Framework to increase resilience. Earth Observation currently feeds into all aspects of the disaster risk reduction cycle and, with upcoming advances, has the potential to contribute even further, particularly for identifying hazard in continental straining areas (Fig. 5).